
Page 30 - RFCUNY Annual Report 2016
P. 30
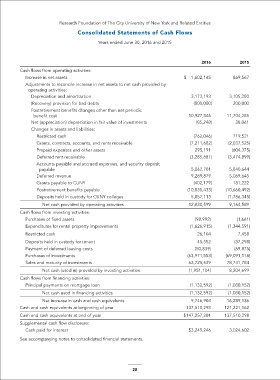
Research Foundation of The City University of New York and Related Entities

                             Consolidated Statements of Cash Flows
                                    Years ended June 30, 2016 and 2015


                                                                          2016         2015
        Cash flows from operating activities:
          Increase in net assets                                   $  1,602,145      869,567
          Adjustments to reconcile increase in net assets to net cash provided by
            operating activities:
            Depreciation and amortization                             3,173,193     3,105,280
            (Recovery) provision for bad debts                         (800,000)     200,000
            Postretirement benefits changes other than net periodic
              benefit cost                                           10,927,846    11,704,285
            Net (appreciation) depreciation in fair value of investments  (85,248)    38,061
            Changes in assets and liabilities:
              Restricted cash                                          (762,046)     719,521
              Grants, contracts, accounts, and rents receivable      (7,211,682)    (2,037,525)
              Prepaid expenses and other assets                        295,191      (604,375)
              Deferred rent receivable                               (3,285,881)    (3,474,899)
              Accounts payable and accrued expenses, and security deposit
                payable                                               5,062,701     5,840,644
              Deferred revenue                                        9,289,879     5,069,645
              Grants payable to CUNY                                   (402,179)     181,222
              Postretirement benefits payable                        (10,830,433)    (10,660,492)
              Deposits held in custody for CUNY colleges              5,857,113     (1,786,345)
                Net cash provided by operating activities            12,830,599     9,164,589
        Cash flows from investing activities:
          Purchases of fixed assets                                    (98,992)       (1,661)
          Expenditures for rental property improvements              (1,626,915)   (1,344,591)
          Restricted cash                                               26,104         7,458
          Deposits held in custody for tenant                           45,552         (37,298)
          Payment of deferred leasing costs                            (50,839)      (69,875)
          Purchases of investments                                   (63,971,553)    (69,091,118)
          Sales and maturity of investments                          63,725,539     78,741,784
                Net cash (used in) provided by investing activities  (1,951,104)    8,204,699
        Cash flows from financing activities:
          Principal payments on mortgage loan                        (1,132,592)    (1,080,152)
                Net cash used in financing activities                (1,132,592)   (1,080,152)
                Net increase in cash and cash equivalents             9,746,903     16,289,136
        Cash and cash equivalents at beginning of year              137,510,298    121,221,162
        Cash and cash equivalents at end of year                   $147,257,201     137,510,298
        Supplemental cash flow disclosure:
          Cash paid for interest                                     $3,249,246     3,024,602
        See accompanying notes to consolidated financial statements.


                                                 28