Page 37 - RFCUNY Annual Report 2016
P. 37

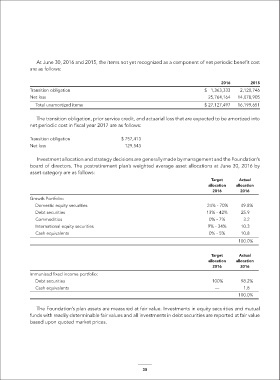
At June 30, 2016 and 2015, the items not yet recognized as a component of net periodic benefit cost
            are as follows:

                                                                                 2016      2015
            Transition obligation                                          $   1,363,333  2,120,746
            Net loss                                                        25,764,164  14,078,905
              Total unamortized items                                      $ 27,127,497  16,199,651

              The transition obligation, prior service credit, and actuarial loss that are expected to be amortized into
            net periodic cost in fiscal year 2017 are as follows:

            Transition obligation            $ 757,413
            Net loss                          129,543

              Investment allocation and strategy decisions are generally made by management and the Foundation’s
            board of directors. The postretirement plan’s weighted average asset allocations at June 30, 2016 by
            asset category are as follows:
                                                                             Target    Actual
                                                                            allocation   allocation
                                                                              2016      2016
            Growth Portfolio:
              Domestic equity securities                                    24% - 70%   49.8%
              Debt securities                                              13% - 42%    25.9
              Commodities                                                   0% - 7%      3.2
              International equity securities                               9% - 34%    10.3
              Cash equivalents                                              0% - 5%     10.8
                                                                                       100.0%

                                                                             Target    Actual
                                                                            allocation   allocation
                                                                              2016      2016
            Immunized fixed income portfolio:
              Debt securities                                                100%       98.2%
              Cash equivalents                                                —          1.8
                                                                                       100.0%

              The Foundation’s plan assets are measured at fair value. Investments in equity securities and mutual
            funds with readily determinable fair values and all investments in debt securities are reported at fair value
            based upon quoted market prices.


                                                    35
   32   33   34   35   36   37   38   39   40   41   42